London Breakout Tracker - Box Style📊 London Breakout Tracker (Pine Script v6)
This script is designed to track the Asian session range and identify breakout opportunities when the London session begins. It highlights high-probability trade setups and helps avoid fakeouts or overly wide ranges.
🧱 1. Session Time Definitions (Adjusted for Kenyan Time)
The Asian session is defined as:
3:00 AM to 11:00 AM (Kenyan Time)
🔐 2. Asian Session High & Low
During the Asian session:
The script tracks the highest high and lowest low to define the range.
These are stored in variables: asianHigh and asianLow.
🧊 3. Box Drawing for the Asian Range
Once the Asian session ends:
A visual box is drawn around the session using box.new().
This box spans from the session start to end bars and from the high to low.
It helps visually see the range price must break out from.
🚨 4. Breakout Signals
After the Asian session:
A Long Breakout signal is generated if:
The candle closes above the Asian High.
A Short Breakout signal is generated if:
The candle closes below the Asian Low.
This corresponds to 00:00 to 08:00 UTC
These are shown with:
✅ Green up label for long breakouts
❌ Red down label for short breakouts
🧯 5. Fakeout Detection
If price breaks out but closes back inside the Asian range, it’s marked as a Fakeout:
Long Fakeout: Price breaks above high, then closes back below.
Short Fakeout: Price breaks below low, then closes back above.
These are marked with orange X-crosses above or below candles.
⚠️ 6. Wide Range Filter
If the Asian session range is too wide (e.g. > 40 pips), a gray background is drawn.
This warns you not to trade that day since breakouts from wide ranges are unreliable.
📣 7. Alert Conditions
The script can trigger alerts in TradingView when:
🔔 A Long or Short Breakout occurs
⚠️ A Fakeout is detected
You can set these up via the TradingView alert system.
🎯 Overall Purpose:
The script helps you:
Clearly see the Asian session range
Identify breakout opportunities at the London open
Avoid trading during fakeouts or wide-range sessions
Get alerted when breakout/fakeout conditions occur
Cari dalam skrip untuk "session high"

Previous Day, Week, Monday Liq + Asian, London & Ny session LiqGM Gs,
This indicator helps traders identify key liquidity levels from different market sessions (Asian, London, NY), as well as weekly and daily highs/lows. It automatically plots these levels on the chart, making it easier to spot potential support/resistance zones where price might react.
Key Features:
1. Multi-Timeframe Liquidity Zones
Previous Day High/Low – Tracks the prior day’s range.
Monday High/Low – Useful for weekly opening liquidity.
Previous Week High/Low – Helps identify broader weekly levels.
2. Customizable Session Times
Asian, London, and NY Session Highs/Lows – Automatically detects and plots key levels from each trading session.
Adjustable Time Zones – Supports multiple GMT offsets (GMT-8 to GMT+3), making it adaptable for traders worldwide.
3. Visual Customization
Color & Style Options – Each level type (e.g., London High, NY Low) can be customized in color, line style (solid, dashed, dotted), and width.
Faded Opacity for Swept Levels – When a level is swept (price breaks but closes beyond it), it becomes semi-transparent, helping traders distinguish active vs. invalidated levels.
4. Clean & Informative Labels
Each level has a clear label (e.g., "Asia High," "PW Low") for easy identification.
Adjustable label offsets prevent clutter on the chart.
Pros & Benefits for Traders:
✅ Helps Identify Key Liquidity Zones – Institutional traders often target session highs/lows for liquidity grabs. This indicator makes these levels visible at a glance.
✅ Adaptable to Different Trading Styles
Day Traders – Can use Asian/London/NY session levels for intraday setups.
Swing Traders – Can focus on weekly and Monday levels for broader trends.
✅ No Repainting – Levels are fixed once formed and do not change retroactively.
✅ Customizable for Personal Preference – Traders can adjust colors, line styles, and visibility to match their trading setup.
✅ Useful for Multiple Markets – Works well on Forex (major pairs), indices, and even crypto (due to 24/7 market structure similarities).
Suggested Use Cases:
Breakout Trading – Watch for price reactions at session highs/lows.
Mean Reversion – Fade moves into weekly or daily extremes.
Institutional Liquidity Analysis – Identify potential stop hunts or accumulation zones.
Conclusion:
This indicator is a powerful tool for traders who rely on session-based liquidity, institutional order flow, and key support/resistance levels. By automating the detection of these zones, it saves time and helps traders make more informed decisions.

Advanced Session Profile Predictor with SR Boxes & ORAdvanced Session Profile Predictor with Momentum Arrows
Designed for intraday traders, this indicator analyzes price action across Asia, London, and New York sessions to predict market profiles and highlight key trading opportunities. By combining session-based profiling, Opening Range (OR) visualization, and momentum signals from Traders Dynamic Index (TDI), it offers a unique tool for anticipating trends, reversals, and breakouts. Ideal for forex, indices, and crypto on 15M–1H charts.
What Makes This Indicator Unique?
Unlike typical session indicators that only mark time zones or standard TDI scripts that focus on momentum, this tool:
Predicts market profiles (e.g., "Trend Continuation," "NY Manipulation") by analyzing session ranges and directional moves, offering actionable insights into how sessions interact.
Visualizes Opening Range (OR) boxes for the first 15 minutes of each session, helping traders spot early breakout levels.
Integrates TDI with momentum to generate precise bullish/bearish arrows, filtered by session context for improved reliability.
Simplifies decision-making with dynamic profile labels showing real-time long/short conditions based on price levels.
How Does It Work?
Session Tracking:
Asia (00:00–08:00 UTC, yellow), London (08:00–16:00 UTC, red), and New York (13:00–21:00 UTC, blue) sessions are highlighted with background colors and high/low lines (crosses).
OR boxes (first 15 minutes) are drawn for each session: yellow for Asia, red for London, blue for NY.
Profile Prediction:
Compares Asia and London session ranges and directions (e.g., trending if range > 1.5x 5-period SMA).
Examples:
Trend Continuation: Asia and London trend in the same direction—long above Asia high (uptrend) or short below Asia low (downtrend).
NY Manipulation: Asia trends, London consolidates—watch for NY breakouts at London high/low.
Displays the predicted profile and entry conditions in labels (e.g., "IF price hits 1.2000 LONG").
Momentum Arrows:
Uses TDI (RSI period 21, bands 34, fast MA 2) and 12-period momentum.
Green up arrow: Fast MA > upper band (>68) and momentum rising (bullish).
Red down arrow: Fast MA < lower band (<32) and momentum falling (bearish).
Support/Resistance (SR):
Plots dynamic SR boxes based on pivot highs/lows, filtered by volume (inspired by ChartPrime’s methodology, credited below).
How to Use It
Setup: Apply to a 15M–1H chart. Adjust time zone (default: UTC) and session times if needed. Customize TDI/momentum settings for sensitivity.
Trading:
Check the top-right labels for the current profile and entry conditions (e.g., "IF price hits LONG/SHORT").
Confirm entries with green up arrows (bullish) or red down arrows (bearish).
Use OR boxes and session high/low lines to identify breakout or reversal levels.
Example: In "NY Manipulation," wait for price to hit London high (long) or low (short) during NY session, confirmed by an arrow.
Best Markets: Forex (EUR/USD), indices (SPX500), crypto (BTC/USD) with sufficient intraday volatility.
Underlying Concepts
Session Profiling: Detects trends (range > SMA * threshold) and manipulation (e.g., London breaking Asia’s high/low) to predict NY behavior.
OR Boxes: Marks the first 15 minutes’ high/low as a breakout zone (time-based, 900,000 ms).
TDI + Momentum: Combines RSI-based bands with price change (close – close ) for momentum signals.
SR Boxes: Identifies pivots over a lookback period (default 20), scaled by ATR and filtered by volume thresholds.
Credits
The SR box logic is inspired by ChartPrime’s volume-filtered support/resistance methodology, adapted with custom breakout/hold detection. Original authors are credited for their foundational work.
Chart Setup
Displays session backgrounds, OR boxes, high/low lines, TDI arrows, and profile labels. Keep other indicators off for clarity.

Pre-London High-Low Breakout IndicatorOverview
The Pre-London High-Low Breakout Indicator helps traders identify breakout opportunities at the London session open. It marks the high and low one hour before London opens (5 PM - 6 PM AEST) and incorporates a 200 SMA filter to confirm trade direction. The indicator also provides real-time breakout markers for precise entries.
How the Indicator Works
1. Pre-London High & Low Identification (5 PM - 6 PM AEST)
The indicator tracks the highest and lowest price levels within this period.
These levels act as key breakout zones once London opens.
The high and low remain visible until 12 AM AEST for reference.
2. 200 SMA as a Trend Filter
A 200 SMA (yellow, thick line) is plotted to filter breakout trades.
Only long (buy) trades are valid if price is above the 200 SMA.
Only short (sell) trades are valid if price is below the 200 SMA.
3. Real-Time Breakout Confirmation
Buy Signal (Green Diamond):
Price breaks above the pre-London high.
Price is above the 200 SMA.
Sell Signal (Red Diamond):
Price breaks below the pre-London low.
Price is below the 200 SMA.
No signal appears if the breakout is against the SMA trend, reducing false trades.
How to Use the Indicator Properly
Step 1: Identify the Pre-London Range (5 PM - 6 PM AEST)
Observe price movements and note the session high & low.
Do not take trades within this period—wait for a clear breakout.
Step 2: Wait for a Breakout After 6 PM AEST
A breakout must occur beyond the session high or low.
The breakout should be clear and decisive, not hovering around the range.
Step 3: Confirm with the 200 SMA
If price is above the 200 SMA, only buy signals are valid.
If price is below the 200 SMA, only sell signals are valid.
If a breakout occurs against the SMA, ignore it.
Step 4: Enter the Trade and Manage Risk
Enter the trade after the breakout candle closes.
Set stop-loss just inside the pre-London range to minimize risk.
Take profit using a 1:2 or 1:3 risk-reward ratio, or trail the stop.
Why This Strategy Works
Pre-London Liquidity Grab: Institutional traders set positions before the London open, making this range significant.
Trend Confirmation with SMA: Reduces false breakouts by filtering trades in the direction of the trend.
Real-Time Breakout Detection: Green and red diamond markers highlight valid breakouts that meet all conditions.
Final Notes
If price breaks out but quickly reverses, it may be a false breakout—avoid impulsive trades.
The indicator works best when combined with other confluences such as volume analysis or key support/resistance levels.
Alerts can be added to notify traders when a valid breakout occurs.
This setup is ideal for traders looking for a structured, rule-based approach to trading London session breakouts with a strong trend confirmation mechanism.

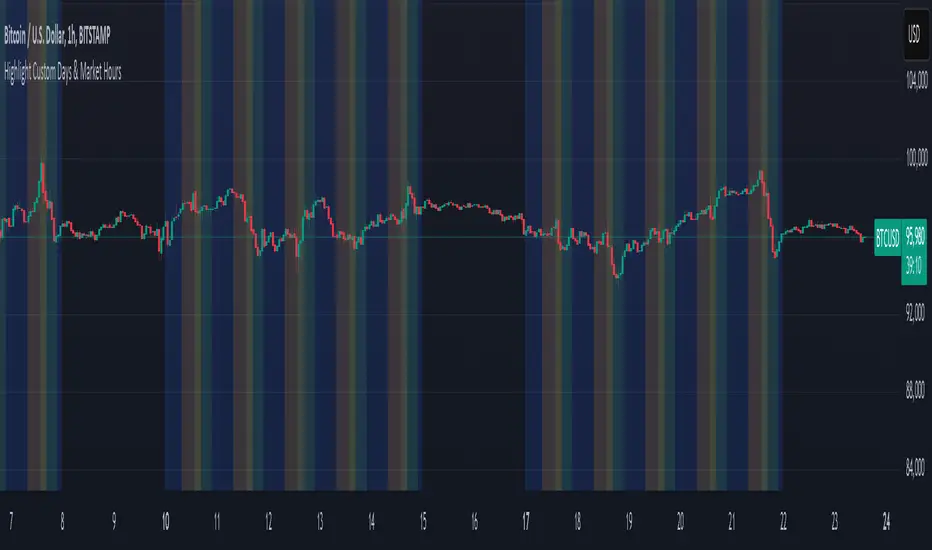
Mon to Fri + LSE and NYSE📌 Highlight Custom Days & Market Hours Indicator 📌
🔹 Overview:
This script allows traders to visually highlight specific weekdays and market sessions directly on their TradingView charts. With customizable checkboxes, you can choose which days of the week to highlight, along with session times for the New York Stock Exchange (NYSE) and London Stock Exchange (LSE).
🔹 Features:
✅ Select individual weekdays (Monday–Friday) to highlight in blue
✅ Highlight NYSE open hours (2:30 PM – 9:30 PM UK time) in green
✅ Highlight LSE open hours (8:00 AM – 4:30 PM UK time) in orange
✅ Ensures NYSE & LSE sessions are only highlighted on weekdays (no weekends)
✅ Clean and simple visualization for enhanced market awareness
🔹 How to Use:
1️⃣ Add the indicator to your TradingView chart
2️⃣ Use the settings panel to enable/disable specific weekdays
3️⃣ Toggle NYSE or LSE session highlights based on your trading preference
🚀 Perfect for traders who follow institutional sessions and want better time-based confluence in their strategies!
One Trading Setup for Life ICT [TradingFinder] Sweep Session FVG🔵 Introduction
ICT One Trading Setup for Life is a trading strategy based on liquidity and market structure shifts, utilizing the PM Session Sweep to determine price direction. In this strategy, the market first forms a price range during the PM Session (from 13:30 to 16:00 EST), which includes the highest high (PM Session High) and lowest low (PM Session Low).
In the next session, the price first touches one of these levels to trigger a Liquidity Hunt before confirming its trend by breaking the Change in State of Delivery (CISD) Level. After this confirmation, the price retraces toward a Fair Value Gap (FVG) or Order Block (OB), which serve as the best entry points in alignment with liquidity.
In financial markets, liquidity is the primary driver of price movement, and major market participants such as institutional investors and banks are constantly seeking liquidity at key levels. This process, known as Liquidity Hunt or Liquidity Sweep, occurs when the price reaches an area with a high concentration of orders, absorbs liquidity, and then reverses direction.
In this setup, the PM Session range acts as a trading framework, where its highs and lows function as key liquidity zones that influence the next session’s price movement. After the New York market opens at 9:30 EST, the price initially breaks one of these levels to capture liquidity.
However, for a trend shift to be confirmed, the CISD Level must be broken.
Once the CISD Level is breached, the price retraces toward an FVG or OB, which serve as optimal trade entry points.
Bullish Setup :
Bearish Setup :
🔵 How to Use
In this strategy, the PM Session range is first identified, which includes the highest high (PM Session High) and lowest low (PM Session Low) between 13:30 and 16:00 EST. In the following session, the price touches one of these levels for a Liquidity Hunt, followed by a break of the Change in State of Delivery (CISD) Level. The price then retraces toward a Fair Value Gap (FVG) or Order Block (OB), creating a trading opportunity.
This process can occur in two scenarios : bearish and bullish setups.
🟣 Bullish Setup
In a bullish scenario, the PM Session High and PM Session Low are identified. In the following session, the price first breaks the PM Session Low, absorbing liquidity. This process results in a Fake Breakout to the downside, misleading retail traders into taking short positions.
After the Liquidity Hunt, the CISD Level is broken, confirming a trend reversal. The price then retraces toward an FVG or OB, offering an optimal long entry opportunity.
The initial take-profit target is the PM Session High, but if higher timeframe liquidity levels exist, extended targets can be set.
The stop-loss should be placed below the Fake Breakout low or the first candle of the FVG.
🟣 Bearish Setup
In a bearish scenario, the market first defines its PM Session High and PM Session Low. In the next session, the price initially breaks the PM Session High, triggering a Liquidity Hunt. This movement often causes a Fake Breakout, misleading retail traders into taking incorrect positions.
After absorbing liquidity, the CISD Level breaks, indicating a shift in market structure. The price then retraces toward an FVG or OB, offering the best short entry opportunity.
The initial take-profit target is the PM Session Low, but if additional liquidity exists on higher timeframes, lower targets can be considered.
The stop-loss should be placed above the Fake Breakout high or the first candle of the FVG.
🔵 Setting
CISD Bar Back Check : The Bar Back Check option enables traders to specify the number of past candles checked for identifying the CISD Level, enhancing CISD Level accuracy on the chart.
Order Block Validity : The number of candles that determine the validity of an Order Block.
FVG Validity : The duration for which a Fair Value Gap remains valid.
CISD Level Validity : The duration for which a CISD Level remains valid after being broken.
New York PM Session : Defines the PM Session range from 13:30 to 16:00 EST.
New York AM Session : Defines the AM Session range from 9:30 to 16:00 EST.
Refine Order Block : Enables finer adjustments to Order Block levels for more accurate price responses.
Mitigation Level OB : Allows users to set specific reaction points within an Order Block, including: Proximal: Closest level to the current price. 50% OB: Midpoint of the Order Block. Distal: Farthest level from the current price.
FVG Filter : The Judas Swing indicator includes a filter for Fair Value Gap (FVG), allowing different filtering based on FVG width: FVG Filter Type: Can be set to "Very Aggressive," "Aggressive," "Defensive," or "Very Defensive." Higher defensiveness narrows the FVG width, focusing on narrower gaps.
Mitigation Level FVG : Like the Order Block, you can set price reaction levels for FVG with options such as Proximal, 50% OB, and Distal.
Demand Order Block : Enables or disables bullish Order Block.
Supply Order Block : Enables or disables bearish Order Blocks.
Demand FVG : Enables or disables bullish FVG.
Supply FVG : Enables or disables bearish FVGs.
Show All CISD : Enables or disables the display of all CISD Levels.
Show High CISD : Enables or disables high CISD levels.
Show Low CISD : Enables or disables low CISD levels.
🔵 Conclusion
The ICT One Trading Setup for Life is a liquidity-based strategy that leverages market structure shifts and precise entry points to identify high-probability trade opportunities. By focusing on PM Session High and PM Session Low, this setup first captures liquidity at these levels and then confirms trend shifts with a break of the Change in State of Delivery (CISD) Level.
Entering a trade after a retracement to an FVG or OB allows traders to position themselves at optimal liquidity levels, ensuring high reward-to-risk trades. When used in conjunction with higher timeframe bias, order flow, and liquidity analysis, this strategy can become one of the most effective trading methods within the ICT Concept framework.
Successful execution of this setup requires risk management, patience, and a deep understanding of liquidity dynamics. Traders can enhance their confidence in this strategy by conducting extensive backtesting and analyzing past market data to optimize their approach for different assets.

The Ultimate strategy by ATK**The Ultimate Strategy by ATK**
This comprehensive trading script is designed to enhance market analysis and trading strategies by integrating advanced tools for market structure, SMT (Separation and Divergence), Fair Value Gaps (FVG), and session-based insights. With customizable features, real-time alerts, and multi-timeframe functionality, this script caters to both scalpers and long-term traders seeking deeper market insights.
### 🔵 **Key Features**
**🔹 SMT (Divergence) Detection:**
- **High/Low SMT Analysis:** Compares highs and lows between a primary symbol (e.g., NQ1!) and a user-defined comparison symbol (e.g., ES1!).
- Automatically visualizes discrepancies with red (highs) and green (lows) lines.
- Supports two modes: real-time comparison and historical range checks.
- Alerts for detected SMT conditions.
- **Close Price SMT Analysis:** Compares closing prices to highlight divergences.
- Includes user-defined lookback periods and granular cycle-based SMT detection.
**🔹 PSP (Precision Swing Point):**
- Detects and highlights price divergences between symbols, such as NQ and ES, with multi-timeframe compatibility (15-minute, 1-hour, 4-hour).
- Integrated PSP table for visualizing divergences across timeframes.
- Configurable for first PSP detection only or all patterns without lower timeframe interference.
**🔹 Session Analysis with ASIA Session Insights:**
- Tracks high and low prices during the Asia session (1:00–7:00 AM Israel time).
- Draws horizontal lines marking session highs and lows.
- Alerts when prices cross session boundaries.
**🔹 FFMS (First Five-Minute Strategy):**
- Utilizes the high and low of the first five minutes of the trading day.
- Generates buy or sell signals based on retracement and breakout conditions around the previous day’s high/low.
- Real-time alerts for long and short opportunities.
**🔹 Multi-Timeframe Tables and Alerts:**
- Displays SMT and PSP conditions across multiple timeframes (1-minute, 15-minute, 1-hour, etc.).
- Alerts for SMT divergences and PSP patterns across selected time intervals.
**🔹 Visual Enhancements and Customizability:**
- Color-coded lines and labels for easy interpretation of SMT, PSP, and session levels.
- User-friendly input settings for symbol selection, session tracking, and cycle configuration.
- Flexible session range adjustments with macro and micro cycle segmentation (90-minute and 6-hour sessions).
### 🎯 **Use Cases**
- **Scalping:** Analyze short-term divergences with real-time SMT and PSP detection on lower timeframes.
- **Swing Trading:** Leverage session-based insights and SMT conditions to identify potential reversal points.
- **Multi-Symbol Analysis:** Compare key indices or assets (e.g., NQ vs. ES) for SMT-based opportunities.
This script is perfect for traders looking to combine advanced tools into a seamless, actionable trading system. Stay ahead of the markets with **The Ultimate Strategy by ATK**!

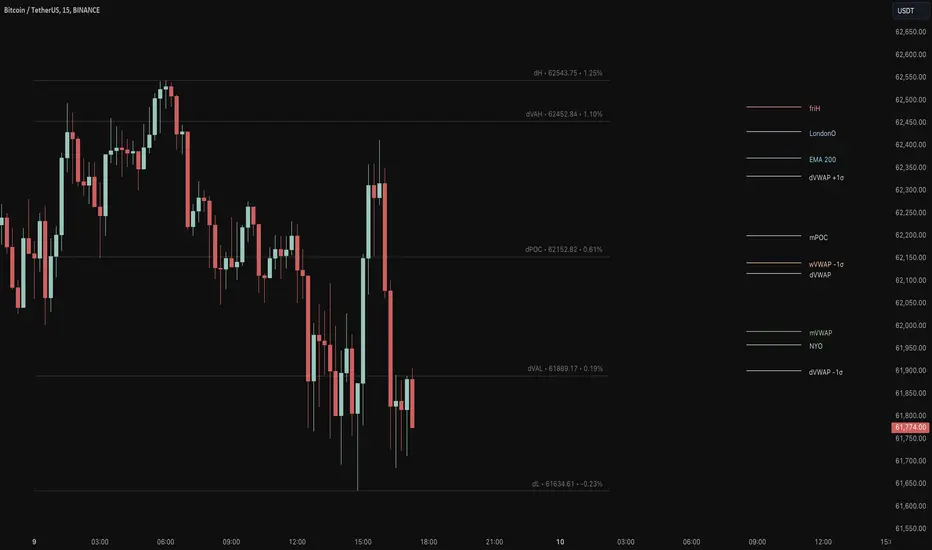
Key Levels Suite - By LeviathanThis is a comprehensive script, designed to display over 100 key price levels across multiple dimensions, including volume profile levels, HTF levels, VWAPs, SMAs/EMAs, market session levels, day of week levels and more. The indicator offers high flexibility in features, settings and visual appearance.
● The script organizes levels into six main categories:
Higher Timeframe (HTF) Levels
- Current and/or previous period: Open, High, Low, and Midpoint for Daily, Weekly, Monthly, Quarterly, and Yearly timeframes (eg. levels for current weekly high/low and previous weekly high/low).
- These levels provide a clear structure for identifying key support and resistance zones. Traders often use HTF levels to anticipate price reactions, such as bounces or rejections, at major highs and lows. For example, a price nearing the weekly high could signal an area of resistance.
VWAP Levels
- Current and/or previous period: VWAP and upper/lower standard deviations for Daily, Weekly, Monthly, Quarterly, and Yearly timeframes (eg. levels for current daily VWAP and previous weekly VWAP).
- VWAP levels give traders insight into whether the current price is above or below the fair market value for a given period. It’s often used as a reference point for trend direction or S/R. If the price remains above VWAP, the trend may be seen as bullish, while breaks below VWAP can suggest a shift toward bearish sentiment. Standard deviations help identify areas where the price may be overextended, offering opportunities for mean reversion trades.
Moving Average Levels
- EMA and SMA for three customizable lengths (eg. levels for 200 EMA, 50 EMA and 100 SMA).
- These levels act as dynamic support and resistance lines that adjust with price movement. Traders use them to confirm trend direction and watch for reactions around these levels, particularly in trending markets. For example, when the price pulls back to a 200 EMA, it could present an opportunity to enter a trade in line with the prevailing trend.
Volume Profile Levels
- Current and previous: Point of Control (POC), Value Area High (VAH), and Value Area Low (VAL) for Daily, Weekly, Monthly, Quarterly, and Yearly timeframes (eg. levels for current day POC and previous day POC).
- Volume Profile levels highlight price areas where significant trading occurred. The POC indicates the price where the most volume was traded and can act as a strong magnet for price. VAH and VAL mark the boundaries of value areas, making them excellent spots for breakout or mean reversion trades. Traders look for price reactions around these zones to either join or fade moves.
Market Session Levels
- Current and previous: Open, high, low, and midpoint for three user-defined sessions, with default being Tokyo, London, and New York (eg. levels for current New York session open and previous New York session high and low).
- Session levels allow traders to track how price behaves across different global market sessions. For instance, the New York open often brings increased liquidity and volatility. Traders often use these levels to anticipate sharp moves or continuations, especially after session highs and lows are broken, signaling shifts in market momentum.
Day of Week Levels
- Open, high, low, and midpoint for Monday through Sunday (eg. levels for Monday's high and low and Tuesday open).
- These levels help traders identify recurring intraday or intraweek price behaviors. For example, highs or lows established earlier in the week can serve as benchmarks for breakouts or retracements later on. Monday’s open or Friday’s high/low often reflect market sentiment going into or out of the weekend, providing valuable clues for planning trades.
● About the script
I published this script because it was heavily requested by my Tradingview followers who wanted a clean and feature-rich indicator that can display various levels they use in their analysis. The indicator can display levels that are not available in other similar public scripts and makes sure to calculate and load calculation-intensive levels (like volume profile levels, higher timeframe vwap levels, etc) as fast and efficiently as possible. It is one of the only scripts I've published that is not open source. The code is protected because it includes some proprietary calculations (eg: for POC/VAH/VAL), that I don't wish to open source, but I still want to publish a heavily requested script in a public and free format.
● How to use the script
1. Add the script to your chart
Start by adding the script to your chart like any other indicator.
2. Open the indicator settings
Click the settings icon to access all customization options.
3. Select which level groups to display
In the "Controls" section, choose which groups of levels (HTF, VWAP, Moving Averages, etc.) you want displayed. This allows you to quickly toggle between different sets of levels depending on your analysis needs, without overcrowding the chart.
4. Adjust group-specific settings
Scroll down to access detailed settings for each group. For any group, you can choose:
- The relevant time parameter (e.g., Daily, Weekly, Monthly, etc for HTF/VWAP/Volume Profile levels, length for Moving Average levels, day for Day of Week Levels, etc).
- Specific levels to display (e.g., Open/High/Low/Midpoint for HTF, VWAP, Day of Week, Session levels and POC/VAH/VAL for Volume Profile levels).
- For applicable groups, you can also toggle previous period levels by selecting them from the row starting with the "↳" icon.
5. Customize visual appearance
In the "Appearance" section, you have full control over how the levels and labels look. You can:
- Choose what details appear in the labels (e.g., level name, price, or percentage distance from current price).
- Pick from different line types, line style (solid, dashed, dotted), adjust line width, and manage the length of the lines using "Offset Right" and "Offset Left" settings.
- Modify font, label size, and color options. If multiple levels overlap at the same price, use the “Merge Levels” option to combine them into one, reducing visual clutter.
6. Customize level names to your preference
In the "Labels" section, you can rename any parameter to match your preferred abbreviations (e.g., change “Weekly Open” to “wO” or any other shorthand that works for you).
● Key Features:
- Display various different important levels, all in one indicator
- Seamless control of which group of levels / specific level to display
- Choose from various line and label styles to display levels.
- Labels can show the level's title (customizable abbreviations), price, and percentage distance from the current price.
- Merge nearby levels to reduce chart clutter, either for identical levels or those within a user-defined percentage range.
- Fully customizable visual appearance of levels to suit individual preferences.
Session Range Breakouts With Targets [AlgoAlpha]⛓️💥Session Range Breakouts With Targets 🚀
Introducing the "Session Range Breakouts With Targets" indicator by AlgoAlpha, a powerful tool for traders to capitalize on session-based range breakouts and identify precise target zones using ATR-based calculations! Whether you trade the Asian, American, European, or Oceanic sessions, this script highlights key breakout levels and targets that adapt to market volatility, ensuring you're always prepared for those crucial price movements. 🕒📊
Session-based Trading : The indicator highlights session-specific ranges, offering clear breakouts for Asian, American, European, Oceanic, and even custom sessions 🌍.
Adaptive Volatility Zones : Uses ATR to determine dynamic zone widths, filtering out fakeouts and adjusting to market conditions ⚡.
Precise Take-Profit Targets : Set multiple levels of take-profits based on ATR multipliers, ensuring you can manage both aggressive and conservative trades 🎯.
Customizable Appearance : Tailor the look with customizable colors for session highlights and breakout zones to fit your chart style 🎨.
Alerts on Key Events : Built-in alert conditions for breakouts and take-profit hits, so you never miss a trading opportunity 🔔.
🚀 Quick Guide to Using the Indicator
🛠 Add the Indicator : Add the indicator to favorites by pressing the star icon. Choose your session (Asia, America, Europe, Oceana, or Custom) and adjust the ATR length, zone width multiplier, and target multipliers to suit your strategy.
📊 Analyze Breakouts : Watch for the indicator to plot upper and lower range boxes based on session highs and lows. Price breaking through these boxes will signal a potential entry.
📈 Monitor Targets : Track bullish and bearish targets as price moves, with up to three take-profit levels based on ATR multipliers.
🔔 Set Alerts : Enable alerts for session breakouts or when price hits your designated take-profit targets.
🔍 How It Works
This script operates by identifying session-specific ranges based on highs and lows from the beginning of the selected session (Asia, America, Europe, or others). After a user-defined wait period (default: 120 bars), it calculates the highest and lowest points and creates upper and lower zones using the Average True Range (ATR) to adapt to market volatility. If the price breaks above or below these zones, it is identified as a breakout, and the script dynamically calculates up to three take-profit targets for both bullish and bearish scenarios using an ATR multiplier. The indicator also includes alerts for breakouts and take-profit hits, providing real-time trading signals.

Sessions KillZones Library [TradingFinder]🔵 Introduction
"The Forex Trading Sessions" highlight the active periods across different markets where significant trading volume and influence on the forex market are evident. The primary trading sessions globally include the "Asian Session," "London Session," and "New York Session."
A "Kill Zone" refers to a segment within a session characterized by high trading volume and notably sharper price movements. Consequently, there's a higher probability of encountering price action setups within these zones. Traders capitalize on this phenomenon in pursuit of more successful trading outcomes.
If you aim to integrate sessions or kill zones into your indicators or strategies, utilizing this library can amplify the precision and efficiency of your Python script development.
🔵 How to Use
First, you can add the library to your code as shown in the example below:
import TFlab/SessionAndKillZoneLibrary_TradingFinder/1
🟣 Parameters
SessionDetector(Session_Name, Session_Time, KillZone_Time, Session_Show, KillZone_Show, AreaUpdate, MoreInfo, Session_Color, Info_Color) =>
Parameters:
•Session_Name (string)
•Session_Time (string)
•KillZone_Time (string)
•Session_Show (bool)
•KillZone_Show (bool)
•AreaUpdate (string)
•MoreInfo (bool)
•Session_Color (color)
•Info_Color (color)
Session_Name : You must enter the session name in this parameter.
Session_Time : Enter here the start and end time of the session, which should be based on the UTC time zone.
KillZone_Time : Enter the start and end times of the kill zone, which should be based on the UTC time zone, here.
Session_Show : You can control whether or not to show the session using this entry. You must set true to display and false to not display.
KillZone_Show : Using this input you can control whether the kill zone is displayed or not. You must set true to display and false to not display.
AreaUpdate : If you want the session to be determined based on the time and high and low of the session itself, you must enter "Session" and if you want the area to be determined based on the time and high and low of the kill zone, you must enter "Kill Zone".
MoreInfo : If you want more information, you should set this entry to true, otherwise set to false. This information includes the number of candles in the area, the length of time in the area and the volume of transactions in the area.
Session_Color : Enter your desired color to display the session at this section. It is recommended to use bright and sharp colors.
Info_Color : Enter your desired color to display more information in this section.
🔵 Function Outputs
The outputs of this function are direct and indirect.
🟣 Indirect outputs
These outputs include session display, kill zone display, and time and volume information of session or kill zone.
🟣 Direct outputs
There are 8 direct outputs, which are:
Session Time : If the Session is active, it outputs 1, and if the Session is inactive, it outputs 0.
Kill Zone Time : If the Kill Zone is active, it outputs 1, and if the Kill Zone is inactive, it outputs 0.
Open : Session opening price.
High : The highest price of the session.
Low : The lowest price of the session.
Close : The last price of the session.
Low Touch Alert : If "Area Update" is in "Kill Zone" mode, if the price reaches the lowest price of the kill zone in the same session after the end of the kill zone, this output will be true. You can use this output to create an alert.
High Touch Alert : If "Area Update" is in "Kill Zone" mode, if the price reaches the highest price of the kill zone in the same session after the end of the kill zone, this output will be true. You can use this output to create an alert.
Important : To use "Open", "High", "Low" and "Close", "Area Update" must be in "Session" mode.

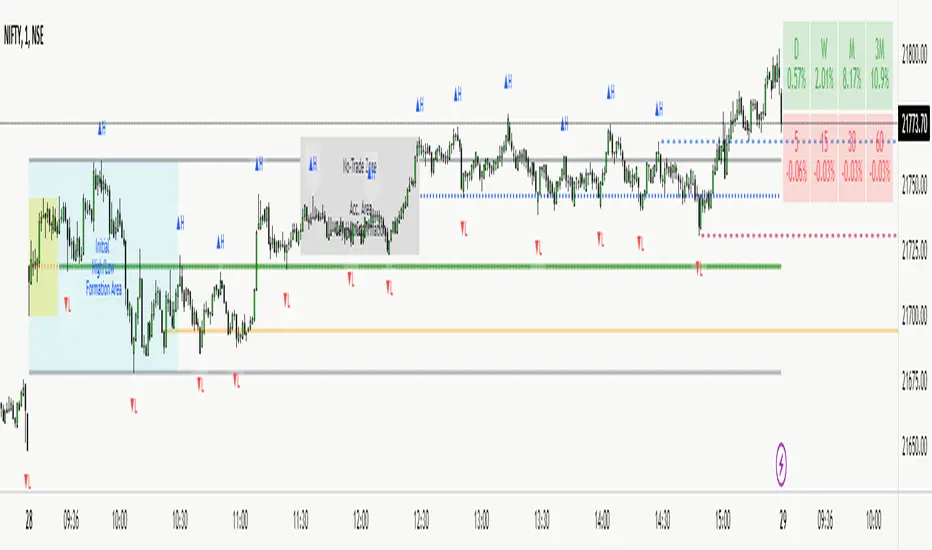
NITS - NIFTY INTRADAY TRADING SYSTEMNSE:NIFTY
Hello Traders..!
This is another indicator / system to make use for NIFTY & BANK NIFTY Intra day trading.
This is my Gift to the traders for this New Year 2024. Use this to your Edge and make some profits. All explained below.
NIFTY INTRA-DAY TRADING SYSTEM
Explanation of Arrays:
-------------------------------
## FIRST 15 MIN SESSION BOX ##
From 09:15 to 09:30 where the initial orders will get collected and Auction takes place.
DO NOT engage into any trade in this session. Let the Box develop.
## INITIAL HIGH / LOW FORMATION SESSION ##
This session is from 09:15 to 10:30.
We can observe the Initial High or Low being formed for the day, that is VALID TILL 11:30.
## NO-TRADE ZONE / ACC. AREA / DAY’S H OR L CONFIRMATION SESSION ##
From 11:30 to 12:30
90% of time this is the session where the whole Day’s High or Low will get confirmed. Sometimes the market may violate this Session!
DO NOT engage into any fresh trade in this area.
Once the box is developed, you can see the Mid price line will be formed which is valid for the afternoon Trading session till 15:30.
## SIGNAL LINE, MIDDLE PRICE LINE, SESSION HIGH LOW LINES ##
Middle Price Line – the dotted line (Red colour) is Mid Price Line for the Initial session box. This acts as an important price level for the whole day.
Signal Line – the Solid line that will form after 10:30. Consider this price line as very important price line to which the price reacts with a good momentum, either break through or rejection and valid for the whole trading day.
Session High Low price line – high and low prices of the Initial session box which acts as a good Support / Resistance / Target / Stop loss. Even previous session’s price lines can also be used for the current day too.
## TREND BOX ##
Multi-Time frame trend box will show the real-time trend on different time frames. This box will be very helpful in trade decision. Please note that at least THREE HIGHER TIME FRAME TRENDS must be in the same direction to support your trade criteria for the better confirmation.
## VOLUME IMBALANCE ##
These orange coloured boxes are very tiny imbalances between prices that were formed during price movements. Algorithm will try to fill these imbalances on its way of filling orders. These price imbalances can be used for our edge while taking trades.
SOME TIPS:
---------------------------
1) Avoid Break out trades
2) Always trade the pull backs
3) Keep your Stops above / below the KEY LEVELS
4) Always follow the Higher Time frame trend while taking a trade.
If you trade in 1m TF consider 5m trend
If you trade in 5m TF consider 1H or 15m trend
5) Consider the higher TF closure of prices only, to validate the break out.
6) Trade what you see, market can do anything it wants.
7) Do not worry about losses. It happens and that is the business.
8) End your trading week in green no matter how big or small the profit is. Consistency is the key this business.
9) Keep in mind that the Market does two things only, either it will FILL THE GAP or GRAB THE LIQUIDITY. Just plan your trades accordingly. Liquidity levels like Previous Session / Day / Week / highs and lows.
10) The Market is a continuous business. It does not end for the specific day. It will not end its Buy or Sell model unless it completes its cycle, hence TRADE WHAT YOU SEE and not WHAT YOU THINK!
11) Unless the key swing high / low is broken and closed, DO NOT consider that move as a reversal. Consider that as a Liquidity grab. And it will continue in its previous trend.
HOW TO TAKE TRADE USING NITS: (one of the Techniques)
--------------------------------------------------------------------------------
As explained above, Do not engage in trade for the first 15 minutes.
Once the 15m box forms then look for divergence between NIFTY and BANK NIFTY.
Both Indices are supposed to trade in the same direction but at key levels and times, these instruments will make DIVERGENCE with its Highs and Lows.
Ex: one Index will make LOW AND LOWER LOW and at the same time other will make LOW AND HIGHER LOW. This deflection can be used for taking Buy Trades.
Ex:
If the Divergence forms at the Bottom then the market will move upwards.
If the Divergence forms at the Top then the market makes down move.
To confirm this divergence, the price will move away from that deflected Lows or Highs.
-----------------------------------
POINTS TO OBSERVE
------------------------------------
Mostly the first 15 min range that forms will either be very large candles or normal candles with rejection wicks or Shaved bar (open and H/L same)
Whenever you observe a very large wide range bars within the 15min range, consider the Day’s high and Low is already formed. And the market will be hovering inside that range only. Very useful for taking 50 points scalping here and there by using the signal line and middle line or Acc box mid line. In this scenario you have three important info of the day, OPEN HIGH & LOW established already, The market will only look for its close.
Ex:
If the market trades with normal candles, then consider your trades in two parts.
From 09:30 to 11:30 and from 12:30 to 15:30 as 11:30 to 12:30 will confirm the current day’s High / Low hence do not take a fresh position within that time.
1) Initial session trade – If the price does not break and close the 15 min range high/low, consider it is going to reverse and continue its trend till 10:30
Ex:
2) Mid session Trade – mostly the market accumulates positions and collects orders between 11:30 to 12:30 for the afternoon session. Once the session box is developed, the middle price line will form. Wait for the market breakout and close off this session’s high or low in Higher TF. The market will continue in the direction of breakout from this session and continue till 15:30. Hence wait for pull back till its mid price / high or low price lines of this Acc box and take trade in the initial breakout direction keeping stop above or below the session’s high or low.
Ex:
## Fixed Range Volume Profile as a Tool ##
-----------------
Note:
-----------------
Kindly do not ask for any codes or script details. The one technique what I explained (Divergence method) is more than enough for making a consistent earnings. Please study and back test / forward test for yourself for atleast 2 weeks time. Every traders aspect and mindset is different in seeing the market movements. Please design your own methodology and CONSIDER this as a BUSINESS..!
JUST.....
Believe the System
Be patient
Be Disciplined &
Be a Successful Earner..!!
LET YOUR ENDS MEET
(Hope I explained well)
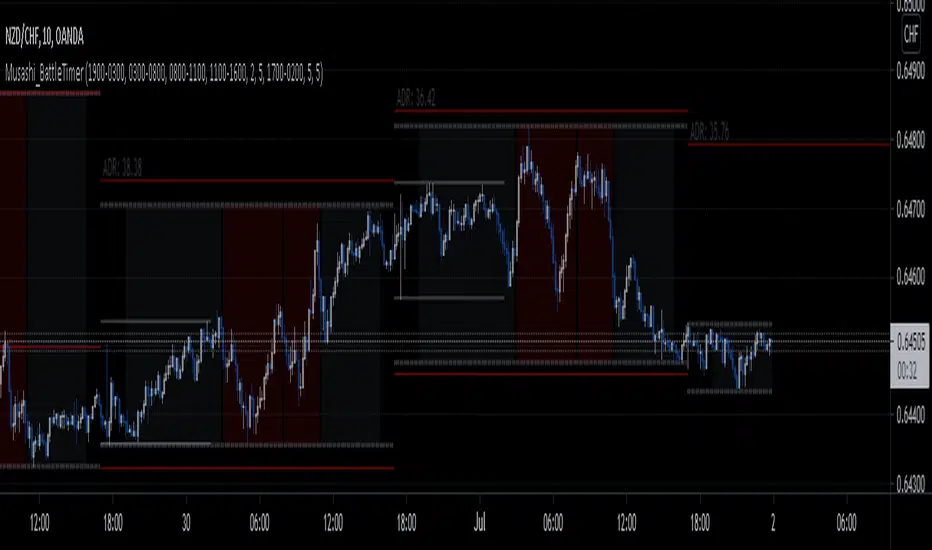
Musashi_BattleTimer-Musashi_Battle Timer-
Four financial sessions presented in a compact way that suits my trading style.
The indicator will do the following:
- Plot Background color separating sessions:
- Highlight Gray since Tokyo open to London open, then a gap.
- Highlight Red from London open to NY open, then a gap.
- Highlight Red from NY open to London Close, then a gap
- Highlight Gray from London close to Sidney open
- Sidney open to Tokio open NO highlight.
- Plot dotted limits for the highest and lowest price of the day.
- Plot a range for the Asian session (Sydney + Tokyo).
- Plot a few day's ADR (Average Daily Range) and extend the current one.
Have a good day.
Volume Profile [Makit0]VOLUME PROFILE INDICATOR v0.5 beta
Volume Profile is suitable for day and swing trading on stock and futures markets, is a volume based indicator that gives you 6 key values for each session: POC, VAH, VAL, profile HIGH, LOW and MID levels. This project was born on the idea of plotting the RTH sessions Value Areas for /ES in an automated way, but you can select between 3 different sessions: RTH, GLOBEX and FULL sessions.
Some basic concepts:
- Volume Profile calculates the total volume for the session at each price level and give us market generated information about what price and range of prices are the most traded (where the value is)
- Value Area (VA): range of prices where 70% of the session volume is traded
- Value Area High (VAH): highest price within VA
- Value Area Low (VAL): lowest price within VA
- Point of Control (POC): the most traded price of the session (with the most volume)
- Session HIGH, LOW and MID levels are also important
There are a huge amount of things to know of Market Profile and Auction Theory like types of days, types of openings, relationships between value areas and openings... for those interested Jim Dalton's work is the way to come
I'm in my 2nd trading year and my goal for this year is learning to daytrade the futures markets thru the lens of Market Profile
For info on Volume Profile: TV Volume Profile wiki page at www.tradingview.com
For info on Market Profile and Market Auction Theory: Jim Dalton's book Mind over markets (this is a MUST)
BE AWARE: this indicator is based on the current chart's time interval and it only plots on 1, 2, 3, 5, 10, 15 and 30 minutes charts.
This is the correlation table TV uses in the Volume Profile Session Volume indicator (from the wiki above)
Chart Indicator
1 - 5 1
6 - 15 5
16 - 30 10
31 - 60 15
61 - 120 30
121 - 1D 60
This indicator doesn't follow that correlation, it doesn't get the volume data from a lower timeframe, it gets the data from the current chart resolution.
FEATURES
- 6 key values for each session: POC (solid yellow), VAH (solid red), VAL (solid green), profile HIGH (dashed silver), LOW (dashed silver) and MID (dotted silver) levels
- 3 sessions to choose for: RTH, GLOBEX and FULL
- select the numbers of sessions to plot by adding 12 hours periods back in time
- show/hide POC
- show/hide VAH & VAL
- show/hide session HIGH, LOW & MID levels
- highlight the periods of time out of the session (silver)
- extend the plotted lines all the way to the right, be careful this can turn the chart unreadable if there are a lot of sessions and lines plotted
SETTINGS
- Session: select between RTH (8:30 to 15:15 CT), GLOBEX (17:00 to 8:30 CT) and FULL (17:00 to 15:15 CT) sessions. RTH by default
- Last 12 hour periods to show: select the deph of the study by adding periods, for example, 60 periods are 30 natural days and around 22 trading days. 1 period by default
- Show POC (Point of Control): show/hide POC line. true by default
- Show VA (Value Area High & Low): show/hide VAH & VAL lines. true by default
- Show Range (Session High, Low & Mid): show/hide session HIGH, LOW & MID lines. true by default
- Highlight out of session: show/hide a silver shadow over the non session periods. true by default
- Extension: Extend all the plotted lines to the right. false by default
HOW TO SETUP
BE AWARE THIS INDICATOR PLOTS ONLY IN THE FOLLOWING CHART RESOLUTIONS: 1, 2, 3, 5, 10, 15 AND 30 MINUTES CHARTS. YOU MUST SELECT ONE OF THIS RESOLUTIONS TO THE INDICATOR BE ABLE TO PLOT
- By default this indicator plots all the levels for the last RTH session within the last 12 hours, if there is no plot try to adjust the 12 hours periods until the seesion and the periods match
- For Globex/Full sessions just select what you want from the dropdown menu and adjust the periods to plot the values
- Show or hide the levels you want with the 3 groups: POC line, VA lines and Session Range lines
- The highlight and extension options are for a better visibility of the levels as POC or VAH/VAL
THANKS TO
@watsonexchange for all the help, ideas and insights on this and the last two indicators (Market Delta & Market Internals) I'm working on my way to a 'clean chart' but for me it's not an easy path
@PineCoders for all the amazing stuff they do and all the help and tools they provide, in special the Script-Stopwatch at that was key in lowering this indicator's execution time
All the TV and Pine community, open source and shared knowledge are indeed the best way to help each other
IF YOU REALLY LIKE THIS WORK, please send me a comment or a private message and TELL ME WHAT you trade, HOW you trade it and your FAVOURITE SETUP for pulling out money from the market in a consistent basis, I'm learning to trade (this is my 2nd year) and I need all the help I can get
GOOD LUCK AND HAPPY TRADING

GODMODE V2.3══════════════════════════════════════════════════════════════
⚡ GODMODE V2.3 PRO ⚡
══════════════════════════════════════════════════════════════
The most visually stunning & powerful trading indicator you'll ever use.
Stop guessing. Start trading with confidence.
══════════════════════════════════════════════════════════════
█▀▀ █▀▀ ▄▀█ ▀█▀ █░█ █▀█ █▀▀ █▀
█▀░ ██▄ █▀█ ░█░ █▄█ █▀▄ ██▄ ▄█
────────────────────────────────
🎯 SMART SIGNAL ENGINE
────────────────────────────────
✦ Multi-Confluence Buy/Sell Signals
Signals only fire when multiple conditions align
✦ RSI Confluence Filter
Eliminates overbought/oversold false signals
✦ Volume Confirmation
Validates signals with volume spikes
✦ Signal Strength Score (0-100%)
Know exactly how strong each setup is
✦ Momentum Detection
Confirms trend direction before entry
────────────────────────────────
🔮 PREDICTION SYSTEM
────────────────────────────────
✦ AI-Powered Prediction Line
Projects price direction with glowing trajectory
✦ Dynamic Target Calculation
Auto-updates with every tick
✦ Confidence Indicators
Visual cues for prediction strength
────────────────────────────────
💎 PREMIUM VISUALS
────────────────────────────────
✦ Neon Glow Moving Averages
5-layer glowing MAs that pulse with the trend
✦ Breathing Gradient Ribbon
Ribbon opacity intensifies with trend strength
✦ Trend Zone Highlighting
Background subtly tints with market direction
✦ Signal Burst Effects
Expanding rings on every buy/sell signal
✦ Price Comet Trail
Fading dots follow price like a shooting star
✦ Trend-Colored Candles
Candles change color based on trend direction
✦ GODMODE Activation Animation
Cinematic startup sequence when loaded
────────────────────────────────
📊 STRUCTURE & LEVELS
────────────────────────────────
✦ Previous Day High/Low (PDH/PDL)
Key institutional levels auto-plotted
✦ Auto Support/Resistance Zones
Algorithm detects and highlights key S/R
✦ Session Highlighting
London • New York • Tokyo sessions marked
with distinct colors
────────────────────────────────
🛡️ RISK MANAGEMENT
────────────────────────────────
✦ Holographic TP/SL Zones
Glowing target and stop loss bands
✦ ATR-Based Calculations
Volatility-adjusted levels for any market
✦ Risk:Reward Display
See your R:R ratio before entering
✦ Customizable Multipliers
Adjust TP/SL to match your style
────────────────────────────────
📈 LIVE DASHBOARD
────────────────────────────────
✦ Real-Time Trend Status
BULLISH / BEARISH / NEUTRAL indicator
✦ Power Gauge
Visual strength meter with percentage
✦ RSI Gauge
Animated RSI bar with value
✦ Volume Status
SPIKE / NORMAL volume indicator
✦ Momentum Tracker
STRONG / RISING / FALLING / WEAK status
✦ Session Display
Shows current active trading session
✦ Signal Direction
LONG / SHORT / WAIT recommendation
✦ Target Price
Live predicted target level
────────────────────────────────
⚙️ TRADING MODES
────────────────────────────────
✦ SCALP MODE
Fast signals with 9/21 MAs
Perfect for 1m-15m timeframes
✦ SWING MODE
Filtered signals with 50/100 MAs
Ideal for 1H-Daily timeframes
────────────────────────────────
🔔 SMART ALERTS
────────────────────────────────
✦ Buy Signal Alert
✦ Sell Signal Alert
✦ High Power Alert (80%+ confluence)
✦ Strong Buy Alert (signal + high power)
✦ Strong Sell Alert (signal + high power)
All alerts include ticker & price.
Compatible with webhooks for automation.
────────────────────────────────
🎨 CUSTOMIZATION
────────────────────────────────
✦ MA Type Selection (EMA/SMA/VWMA)
✦ Adjustable MA Lengths
✦ RSI Threshold Controls
✦ Volume Sensitivity
✦ TP/SL Multipliers
✦ Prediction Range
✦ Toggle Any Visual On/Off
✦ Dashboard Position Selection
✦ Session Time Customization
══════════════════════════════════════════════════════════════
█░█░█ █▀█ █▀█ █▄▀ █▀ █▀█ █▄░█
▀▄▀▄▀ █▄█ █▀▄ █░█ ▄█ █▄█ █░▀█
✓ All Markets (Forex, Crypto, Stocks, Indices)
✓ All Timeframes (1m to Monthly)
✓ TradingView (Desktop & Mobile)
══════════════════════════════════════════════════════════════
█░█░█ █░█ ▄▀█ ▀█▀ ▀ █▀ █ █▄░█ █▀▀ █░░ █░█ █▀▄ █▀▀ █▀▄
▀▄▀▄▀ █▀█ █▀█ ░█░ ░ ▄█ █ █░▀█ █▄▄ █▄▄ █▄█ █▄▀ ██▄ █▄▀
✦ Lifetime access to GODMODE V2.3 PRO
✦ All future updates included
✦ Works on unlimited charts
✦ Full customization options
✦ Priority support via DM
══════════════════════════════════════════════════════════════
█▀▀ ▄▀█ █▀█
█▀░ █▀█ ▀▀█
Q: Does this repaint?
A: Signals are confirmed on bar close. No repainting.
Q: What markets does this work on?
A: All markets — Forex, Crypto, Stocks, Futures, Indices.
Q: What timeframe is best?
A: Scalp Mode for 1m-15m. Swing Mode for 1H+. Works on all.
Q: Do I get updates?
A: Yes, all future updates are included free.
Q: How do I get access?
A: After purchase, send me your TradingView username.
Access granted within 24 hours (usually faster).
══════════════════════════════════════════════════════════════
⚡ GODMODE V2.3 PRO — $50 ⚡
══════════════════════════════════════════════════════════════

ICT Killzones & Sessions Pro |MC|ICT Killzones & Sessions Pro |MC|
Credits go to LuxAlgo for the great work 👍
This indicator has been further developed and enhanced with additional features.
This indicator highlights key market sessions and killzones directly on your chart, helping traders identify high-probability trading periods.
💎 Key features include 💎
🔸Display of major market sessions such as Asia, London, and New York (AM/PM) with customizable times and colors.
🔸Transparent session highlighting for visual clarity without cluttering the chart.
🔸Configurable vertical border lines with adjustable style, width, and color.
🔸Timeframe-based display limits to hide killzones on higher timeframes.
🔸Fully adjustable label size for easy identification of sessions.
🔸Customizable UTC offset to align sessions with your preferred timezone.
Designed for day traders and scalpers, it visually separates market sessions for better trade planning and timing.
Happy Trading!

Killzones & DoL's by @mohtradesThe KillZones & DoLs indicator is a comprehensive tool designed for ICT and institutional traders. It provides a clean, customizable way to visualize key time-based levels, killzone sessions, and daily/weekly/monthly statistics directly on your chart.
Key Features
1. Killzones & Sessions
Visualize the three major trading sessions with customizable boxes and time ranges:
Asia Range: Default 20:00 - 00:00 (NY Time)
London Killzone: Default 02:00 - 05:00 (NY Time)
New York Killzone: Default 09:30 - 16:00 (NY Time)
Killzone Tools:
Boxes: Draw highlighted boxes for each session.
Pivots: Automatically mark the High and Low of each session.
Midpoints: Optionally show the 50% equilibrium level of the session range.
Extensions: Extend pivot lines until they are mitigated (price touches them) or keep them for a set duration.
Alerts: Get notified when a session High or Low is broken.
2. Highs & Lows (HTF Levels)
Track significant liquidity levels from higher timeframes without switching charts:
Previous Day High/Low (PDH/PDL)
Previous Week High/Low (PWH/PWL)
Previous Month High/Low (PMH/PML)
Current High/Low of Day (HOD/LOD): Tracks the developing high and low of the current day.
Current High/Low of Week (HOW/LOW): Tracks the developing high and low of the current week.
3. Opening Price Lines
Mark key opening prices to use as support/resistance or bias confirmation:
True Day Open (00:00 NY)
Week Open
Month Open
Custom Open Lines: Configure up to 8 custom time-based open price lines (e.g., 06:00, 10:00, 14:00).
4. Separators & Statistics
Period Separators: Vertical lines marking the start of new Days, Weeks, or Months.
Range Table: Display the range (in pips/points) of recent sessions and their average to gauge volatility.
Customization
Timezone: Fully adjustable to your preferred timezone (default America/New_York).
Styling: Customize colors, line styles, widths, and label sizes for all elements.
Drawing Limits: Optimize chart cleanliness by limiting historical drawings to the last N days.
How to Use
Add the indicator to your chart.
Open Settings to enable/disable specific Killzones (Asia, London, NY).
Enable "Show PDH/PDL" or "Show HOW/LOW" to track liquidity.
Set your convenient timezone (typically NY for ICT concepts).
Use alerts to catch liquidity runs on session pivots.

Session ATR Progression Tracker📊 Session ATR Progression Tracker - SIYL Regression Trading Tool
Track how much of your instrument's 7-day Average True Range (ATR) has been covered during the current trading session. This indicator is specifically designed for regression traders who follow the "Stay In Your Lane" (SIYL) methodology, helping you identify when the probability of mean reversion significantly increases. If you are interested in more on that check out Rod Casselli and tradersdevgroup.com.
🎯 Key Features:
• Real-time ATR Coverage Percentage - See at a glance what percentage of the 7-day ATR has been covered in the current session
• SIYL-Optimized Thresholds - See at a glance when the instrument has achieved 80% and 100% ATR coverage, the proven thresholds where mean reversion probability increases (customizable)
• Flexible Session Modes:
- Daily: Resets at calendar day change
- Session: Uses exchange-defined trading sessions
- Custom Session: Set your exact session start/end times (perfect for futures traders and international markets)
• Visual Alerts - Color-coded display (gray → orange → red) and optional background highlighting
• Repositionable Display - Choose from 9 screen positions to avoid chart clutter
• Session Markers - Green triangles mark the start of each new session
• Detailed Stats - View current range, ATR value, session high/low, and session status
💡 Why Use This Indicator?
This tool is built around a proven concept: regression trading becomes significantly more effective once a session has achieved at least 80% of its 7-day ATR. At this threshold, the probability of price reverting to mean increases substantially, creating higher-probability trade setups for SIYL practitioners.
Benefits for regression traders:
- Identify optimal entry points when mean reversion probability is highest (≥80% ATR coverage)
- Avoid premature regression entries before adequate range has been established
- Recognize when daily moves have "earned their range" and are ripe for reversal
- Time fade-the-move and counter-trend strategies with statistical backing
- Improve win rates by trading only after proven probability thresholds are met
⚙️ Setup Instructions:
1. Add the indicator to your chart
2. Select your preferred "Reset Mode" (recommend "Custom Session" for futures/international markets)
3. If using Custom Session, enter your session times in 24-hour format (e.g., 0930-1600 for US stocks, 1700-1600 for CME futures)
4. Adjust alert thresholds if desired (default: 80% and 100% - proven SIYL thresholds)
5. Position the display where it's most visible on your chart
📈 Works Across All Markets:
Stocks • Futures • Forex • Indices • Crypto • Commodities
Perfect for regression traders, mean reversion specialists, and SIYL practitioners who want to trade with probability on their side by entering only after the session has "earned its range."
---
Tip: For futures contracts with overnight sessions that span calendar days (like MES, MNQ, MYM), use "Custom Session" mode with your exchange's official session times for accurate tracking.

MP SESSIONS, DST, OTTHere’s a clear description you can use for this script (for yourself or as a TradingView “Indicator Description”):
---
### MP SESSIONS, DST, OTT – What this indicator does
This script is a **multi-session market timing tool** that:
1. **Draws full trading sessions on the chart** (Asia, Sydney, Tokyo, Shanghai, Europe, London, New York, NYSE)
2. **Automatically adjusts for Daylight Saving Time (DST)** for Sydney, London, and New York
3. **Shows a live info table** with session times, DST status, and whether each session is currently open or closed
4. **Adds optional custom “OTT” vertical lines** at user-defined intraday times (for your own models, killzones, or time blocks)
---
### Main Features (high level)
#### 1. Market mode & time zone handling
* **Market Mode**:
* `Forex`
* `Stock`
* `User Custom` (you type your own session ranges)
* `TFlab suggestion` (predefined “optimized” session times)
* **Time Zone Mode**:
* `UTC`
* `Session Local Time` (local exchange time: Sydney, Tokyo, London, New York etc.)
* `Your Time Zone` (converts to the user-selected TZ, e.g. `UTC-4:00`)
* Handles separate time zones for:
* Asia, Sydney, Tokyo, Shanghai, Europe, London, New York, NYSE
* Has logic to **recalculate session start/end depending on DST** and the chosen mode.
---
#### 2. Daylight Saving Time (DST) engine
The function `DST_Detector`:
* Calculates when DST **starts and ends** for:
* `Australia/Sydney`
* `Europe/London`
* `America/New_York`
* Detects the correct Sunday (2nd, 4th, etc.) for start/end using day-of-week and week counts.
* Returns `'Active'` or `'Inactive'` for each region.
* These values are then used to **shift the sessions** (e.g. New York 13:00–21:00 vs 12:00–20:00 in UTC).
The script can also **draw vertical lines** on the chart when DST starts/ends and label them:
* “Sydney DST Started / Ended”
* “London DST Started / Ended”
* “New York DST Started / Ended”
---
#### 3. Session timing & sessions on the chart
The function `Market_TimeZone_Calculator`:
* Based on **Market Mode** + **Time Zone Mode** + **DST state**, it returns:
* Time ranges for: Sydney, Tokyo, Shanghai, Asia (combined), Europe, London, New York, NYSE
* These ranges are in `"HHMM-HHMM"` format.
Then the script:
* Converts these to `time()` conditions using the proper time zone
* Creates boolean series like `On_sesAsia`, `On_sesEurope`, `On_sesNewYork`, etc., which are **1 when the session is open and 0 when closed**.
---
#### 4. Session high/low boxes & labels
The function `LowHighSessionDetector`:
* Tracks **high and low of each session** while it’s active.
* When a new session starts:
* Resets and starts recording the session high/low.
* While session is active:
* Updates `High` with the max of current bar high and previous session high.
* Updates `Low` with the min of current bar low and previous session low.
* When the session is "on":
* Draws a **box** from session low to high (`box.new`) and extends it to the right as long as the session continues.
* Places a **label with session name** (Asia, London, New York, etc.) near the high:
* Style depends on the session (down/right/left).
You have visibility toggles per session:
* `Asia Session`, `Sydney Session`, `Tokyo Session`, `Shanghai Session`, `Europe Session`, `London Session`, `New York Session`, `NYSE` (for TFlab mode).
So you visually see:
* A shaded box for each session
* The full H/L range for that session
* A text label with the session name.
---
#### 5. Info table
The indicator builds a **table in a corner of the chart** showing:
* Header:
* “FOREX Session”, “Stock Market Trading Hours”, “User Custom Session”, or “TFlab suggestion” depending on mode.
* Columns:
1. Session name (Asia, Sydney, Tokyo, Shanghai, Europe, London, New York, NYSE)
2. DST status for that region (“Active 🌞 / Inactive 🍂 / Not Observed”)
3. Session **start time**
4. Session **end time**
5. Current **status** (“Open / Closed”, with green/red background)
The function `SplitFunction`:
* Parses the `"HHMM-HHMM"` strings for each session.
* Converts them into:
* Either raw times (if viewing in UTC/session local)
* Or converted times in **Your Time Zone** using `timestamp` and `hour/ minute` with `YourTZ`.
* Returns formatted `Start` and `End` strings like `9:30`, `13:00`, etc.
So the table is effectively a **live session schedule** that:
* Auto-adjusts to DST
* Can show times in your own time zone
* Shows which session is open right now.
---
#### 6. OTT vertical lines (custom intraday markers)
At the bottom, there is an **OTT section** which lets you draw up to **three sets of vertical lines** at specific times:
* Each OTT block has:
* Enable toggle (`Enable OTT 1/2/3`)
* Start hour & minute
* End hour & minute
* Color
* Global OTT settings:
* Line style: `Solid / Dashed / Dotted`
* Line width
* Toggle: “Show OTT Labels?”
Logic:
* `is_ott_time()` checks if current bar’s `hour` and `minute` match the OTT input time.
* `draw_ott()`:
* When the bar time matches, draws a **vertical line** through the candle from low to high (`extend.both`).
* Optionally adds a label above the bar, like `"OTT1 Start"`, `"OTT1 End"`, etc.
Use cases:
* Marking **open/close of your trading session**
* Defining **killzones**, news times, or custom model windows
* Visual anchors for your intraday routine (NY open, 10 AM candle, etc.)
---
### TL;DR
This indicator is a **session toolkit + DST engine + time markers**:
* **Visually paints the main global sessions** with boxes and labels.
* **Handles DST automatically** for Sydney, London, New York.
* **Shows a live table** with session times, DST status, and open/closed status in your time zone.
* **Adds up to three configurable vertical time markers (OTT)** for custom session windows or key times.
If you want, I can also write a **short version** (2–3 sentences) for the TradingView “Description” field.

MP SESSIONS, DST, OTTMP SESSIONS, DST, OTT – What this indicator does
This script is a multi-session market timing tool that:
Draws full trading sessions on the chart (Asia, Sydney, Tokyo, Shanghai, Europe, London, New York, NYSE)
Automatically adjusts for Daylight Saving Time (DST) for Sydney, London, and New York
Shows a live info table with session times, DST status, and whether each session is currently open or closed
Adds optional custom “OTT” vertical lines at user-defined intraday times (for your own models, killzones, or time blocks)
Main Features (high level)
1. Market mode & time zone handling
Market Mode:
Forex
Stock
User Custom (you type your own session ranges)
TFlab suggestion (predefined “optimized” session times)
Time Zone Mode:
UTC
Session Local Time (local exchange time: Sydney, Tokyo, London, New York etc.)
Your Time Zone (converts to the user-selected TZ, e.g. UTC-4:00)
Handles separate time zones for:
Asia, Sydney, Tokyo, Shanghai, Europe, London, New York, NYSE
Has logic to recalculate session start/end depending on DST and the chosen mode.
2. Daylight Saving Time (DST) engine
The function DST_Detector:
Calculates when DST starts and ends for:
Australia/Sydney
Europe/London
America/New_York
Detects the correct Sunday (2nd, 4th, etc.) for start/end using day-of-week and week counts.
Returns 'Active' or 'Inactive' for each region.
These values are then used to shift the sessions (e.g. New York 13:00–21:00 vs 12:00–20:00 in UTC).
The script can also draw vertical lines on the chart when DST starts/ends and label them:
“Sydney DST Started / Ended”
“London DST Started / Ended”
“New York DST Started / Ended”
3. Session timing & sessions on the chart
The function Market_TimeZone_Calculator:
Based on Market Mode + Time Zone Mode + DST state, it returns:
Time ranges for: Sydney, Tokyo, Shanghai, Asia (combined), Europe, London, New York, NYSE
These ranges are in "HHMM-HHMM" format.
Then the script:
Converts these to time() conditions using the proper time zone
Creates boolean series like On_sesAsia, On_sesEurope, On_sesNewYork, etc., which are 1 when the session is open and 0 when closed.
4. Session high/low boxes & labels
The function LowHighSessionDetector:
Tracks high and low of each session while it’s active.
When a new session starts:
Resets and starts recording the session high/low.
While session is active:
Updates High with the max of current bar high and previous session high.
Updates Low with the min of current bar low and previous session low.
When the session is "on":
Draws a box from session low to high (box.new) and extends it to the right as long as the session continues.
Places a label with session name (Asia, London, New York, etc.) near the high:
Style depends on the session (down/right/left).
You have visibility toggles per session:
Asia Session, Sydney Session, Tokyo Session, Shanghai Session, Europe Session, London Session, New York Session, NYSE (for TFlab mode).
So you visually see:
A shaded box for each session
The full H/L range for that session
A text label with the session name.
5. Info table
The indicator builds a table in a corner of the chart showing:
Header:
“FOREX Session”, “Stock Market Trading Hours”, “User Custom Session”, or “TFlab suggestion” depending on mode.
Columns:
Session name (Asia, Sydney, Tokyo, Shanghai, Europe, London, New York, NYSE)
DST status for that region (“Active 🌞 / Inactive 🍂 / Not Observed”)
Session start time
Session end time
Current status (“Open / Closed”, with green/red background)
The function SplitFunction:
Parses the "HHMM-HHMM" strings for each session.
Converts them into:
Either raw times (if viewing in UTC/session local)
Or converted times in Your Time Zone using timestamp and hour/ minute with YourTZ.
Returns formatted Start and End strings like 9:30, 13:00, etc.
So the table is effectively a live session schedule that:
Auto-adjusts to DST
Can show times in your own time zone
Shows which session is open right now.
6. OTT vertical lines (custom intraday markers)
At the bottom, there is an OTT section which lets you draw up to three sets of vertical lines at specific times:
Each OTT block has:
Enable toggle (Enable OTT 1/2/3)
Start hour & minute
End hour & minute
Color
Global OTT settings:
Line style: Solid / Dashed / Dotted
Line width
Toggle: “Show OTT Labels?”
Logic:
is_ott_time() checks if current bar’s hour and minute match the OTT input time.
draw_ott():
When the bar time matches, draws a vertical line through the candle from low to high (extend.both).
Optionally adds a label above the bar, like "OTT1 Start", "OTT1 End", etc.
Use cases:
Marking open/close of your trading session
Defining killzones, news times, or custom model windows
Visual anchors for your intraday routine (NY open, 10 AM candle, etc.)

Single Prints and Poor Highs/Lows [Real-Time]This indicator is designed for traders utilizing Auction Market Theory (AMT) who need real-time visibility into market structure inefficiencies. Unlike standard TPO tools that often wait for closed bars or finished sessions, this script builds a developing TPO profile tick-by-tick to identify Single Prints and Poor Highs/Lows the moment they form.
Key Features:
Real-Time Single Prints: Automatically detects and highlights areas of single-print inefficiencies (buying/selling tails) as they happen. These "ghost" boxes persist on the chart until price repairs (fills) them, acting as immediate targets or support/resistance zones.
Poor High/Low Detection: Strictly implements AMT logic to identify "unfinished" auctions. If a session extreme is formed by two or more TPO blocks (indicating a flat top/bottom rather than a rejection tail), it marks the level with a dotted line.
Repair Logic: Both Single Prints and Poor High/Low lines are dynamic. If price revisits and repairs the structure, the markers automatically vanish to keep your chart clean.
Session Control: Fully customizable RTH (Regular Trading Hours) session input (default 08:30–15:15) to ensure profiles are built on relevant liquidity.
Quantization: Adjustable "Ticks per Block" allowing you to tune the sensitivity of the TPO profile to different assets (ES, NQ, CL, etc.).
How It Works:
TPO Construction: The script breaks the session into 30-minute periods (configurable) and tracks price overlap.
Single Prints: When the market expands rapidly, leaving gaps in the profile (single TPO blocks), a box is drawn. If price trades back through this box, it deletes itself.
Poor Extremes: It monitors the current session High and Low. If the extreme price level has a TPO count of ≥ 2, it is flagged as "Poor." If the extreme is a single print (count = 1), it is considered a valid tail and left unmarked.
Settings:
RTH Session: Define your specific trading session time.
TPO Period: Default is 30 minutes (standard AMT).
Ticks per Block: Controls the vertical resolution of the TPO. (Higher values = coarser profile, Lower values = more precision).
Colors: Fully customizable colors for Live Prints, Historical Prints, and Poor High/Low lines.
Usage:
Use this tool to spot immediate structural targets. A Poor High often acts as a magnet for price to revisit and "repair," while Single Prints often defend as support/resistance on the first retest.
NQ Market DNA MapNQ Market DNA Map
The Market DNA Map indicator is designed to visualize key trading sessions (Asia, London, and New York) on the chart while providing a probabilistic lookup table based on historical session patterns. This tool draws session boxes with midline references, extends session highs and lows until mitigated or a daily hardstop (16:00 in the selected timezone), and displays a summary table with statistical metrics derived from predefined historical data. The data mappings are hardcoded, reflecting an analytical approach for session-based price action. Note that all probabilities and metrics are based on past observations and should not be interpreted as predictions or guarantees of future market behavior. These statistics are only tested and generated based on NQ futures. This indicator is for educational and informational purposes only; trading decisions should incorporate additional analysis and risk management.
Key Features
• Session Visualization:
o Draws colored boxes for the Asia, London, and New York sessions, updating in real-time as the session progresses.
o Includes a dotted midline within each box for quick reference to the session's midpoint.
o Extends horizontal lines from the final session high and low until price mitigates them (crossing both above and below) or the daily hardstop is reached.
• Probabilistic Table:
o A customizable-position table appears on the chart (once the New York open is detected), summarizing conditions and metrics for the current day's setup.
o Conditions include: Asia range relative to its rolling average, London open relative to Asia's midpoint, London sweep type (high only, low only, both, or none), and New York open relative to London's midpoint.
o Metrics displayed include:
First High Sweep %: Probability (based on historical data) that the high of the prior session is swept first during New York.
First Low Sweep %: Probability that the low is swept first.
Med Pen ↑ (High): Median penetration distance (in points) above the session high.
Med Pen ↓ (Low): Median penetration below the session low.
Fail High -> Low %: Failure rate where an initial high sweep fails and reverses to sweep the low.
Fail Low -> High %: Failure rate for an initial low sweep reversing to the high.
Sample Size: Number of historical observations for the matching pattern (n value), with a rating of "High" (n ≥ 150), "Mid" (n ≥ 75), or "Low" (n < 75) to indicate data reliability.
o The table uses color-coding for quick interpretation: Green for above-average/above-mid conditions, red for below, and neutral tones for metrics.
• Asia Range Ratio: Calculates a rolling average of Asia session ranges over a user-defined lookback period to classify the current Asia range as above or below average.
• Hardstop Logic: All extensions cease at 16:00 in the selected timezone to align with typical daily cycle resets.
Inputs and Customization
• Calculation Timezone: Select from predefined options (e.g., "America/New_York", "Europe/London") to align session times with your preferred market clock. Default: "America/New_York".
• Session Times:
o Asia Session: Default "2000-0200" (8:00 PM to 2:00 AM in the selected timezone).
o London Session: Default "0200-0800" (2:00 AM to 8:00 AM).
o NY Session: Default "0800-1600" (8:00 AM to 4:00 PM). These can be adjusted to match specific market hours or personal preferences.
• Asia Ratio Rolling Window: Integer lookback (default: 20) for calculating the average Asia session range ratio (range divided by open price).
• Table Position: Choose where the summary table appears on the chart (e.g., top_right, bottom_right). Default: top_right.
• Colors: Customizable box fill and border colors for each session (Asia: yellow tones, London: blue, NY: gray) with transparency settings for overlay compatibility.
How It Works
1. Session Detection: The indicator checks the current bar's time against user-defined sessions in the selected timezone. Sessions are non-overlapping and assume a 24-hour cycle.
2. Box and Line Drawing:
o At session start, a box is initialized from the open/high/low.
o As the session progresses, the box expands to capture the live high/low, with the midline updating dynamically.
o Upon session end, final high/low are locked, and extension lines are drawn horizontally.
o Extensions persist until price fully mitigates the level (high ≥ level and low ≤ level) or the hardstop time is passed.
3. Asia Ratio Calculation: Maintains a historical array of Asia range ratios (high-low divided by open). The current ratio is compared to the average over the lookback to classify as "Above Avg" or "Below Avg".
4. Key Generation and Lookup:
o A unique key is built from four binary/ternary codes: Asia classification (0/1), London open vs. Asia mid (0/1), London sweep type (0=high only, 1=low only, 2=both, 3=none), NY open vs. London mid (0/1).
o This key queries a hardcoded map of historical data (e.g., "0_0_0_0" for above-avg Asia, above-mid London open, high-only sweep, above-mid NY open).
o Data includes sample size, probabilities, failure rates, and median penetrations, all derived from historical analysis (total samples across all keys: approximately 5,000+ based on the provided mappings).
5. Table Rendering: On the last bar (real-time), the table populates with the current key's data. Metrics are formatted for readability, and penetration values are scaled to the current London high/low in points for context.
6. Performance Notes: The indicator uses up to 500 lines and boxes for extensions and visuals, ensuring compatibility with TradingView limits. It is overlay=true, so it plots directly on the price chart.
Data Source and Limitations
The probabilistic data is hardcoded and represents a compilation of historical session patterns from backtested or observed market behavior on NQ futures. Exact data collection methodology is not specified in the script, but values are presented as-is for illustrative purposes. Users should verify applicability to their specific symbol/timeframe, as markets evolve and past patterns may not repeat. Low-sample patterns (rated "Low") have higher uncertainty.
This indicator does not generate buy/sell signals, alerts, or trading strategies—it solely provides visual and statistical context. Always combine with other tools, fundamental analysis, and proper risk controls. Trading involves risk of loss; no performance guarantees are implied. If republishing or modifying, please credit the original structure and adhere to TradingView's publication guidelines. For questions on usage, refer to TradingView documentation on session indicators and probabilistic tools.

RiskCraft - Advanced Risk Management SystemRiskCraft – Risk Intelligence Dashboard
Trade like you actually respect risk
"I know the setup looks good… but how much am I actually risking right now?"
RiskCraft is an open-source Pine Script v6 indicator that keeps risk transparent directly on the chart. It is not a signal generator; it is a risk desk that calculates size, frames volatility, and reminds you when your behaviour drifts away from the plan.
Core utilities
Calculates professional-style position sizing in real time.
Reads volatility and market regime before position size is confirmed.
Adjusts risk based on the trader’s emotional state and confidence inputs.
Maps session risk across Asian, London, and New York hours.
Draws exactly one stop line and one target line in the preferred direction.
Provides rotating education tips plus contextual warnings when risk escalates.
It is intentionally conservative and keeps you in the game long enough for any separate entry logic to matter.
---
Chart layout checklist
Use a clean chart on a liquid symbol (e.g., AMEX:SPY or major FX pairs).
Main RiskCraft dashboard placed on the right edge.
Session Risk box on the left with UTC time visible.
Floating risk badge above price.
Stop/target guide lines enabled.
Education panel visible in the bottom-right corner.
---
1. On-chart components
Right-side dashboard : account risk %, position size/value, stop, target, risk/reward, regime, trend strength, emotional state, behavioural score, correlation, and preferred trade direction.
Session Risk box : highlights active session (Asian, London, NY), current UTC time, and risk label (High/Med/Low) per session.
Floating risk badge : keeps actual account risk percent visible with colour-coded wording from Ultra Cautious to Very Aggressive.
Stop/target lines : exactly one dashed stop and one dashed target aligned with the preferred bias.
Education panel : rotates core principles and AI-style warnings tied to volatility, risk %, and behaviour flags.
---
2. Volatility engine – ATR with context 📈
atr = ta.atr(atrLength)
atrPercent = (atr / close) * 100
atrSMA = ta.sma(atr, atrLength)
volatilityRatio = atr / atrSMA
isHighVol = volatilityRatio > volThreshold
ATR vs ATR SMA shows how wild price is relative to recent history.
Volatility ratio above the threshold flips isHighVol , which immediately trims risk.
An ATR percentile rank over the last 100 bars indicates calm versus chaotic regimes.
Daily ATR sampling via request.security() gives higher time-frame context for intraday sessions.
When volatility spikes the script dials position size down automatically instead of cheering for maximum exposure.
---
3. Market regime radar – Danger or Drift 🌊
ema20 = ta.ema(close, 20)
ema50 = ta.ema(close, 50)
ema200 = ta.ema(close, 200)
trendScore = (close > ema20 ? 1 : -1) +
(ema20 > ema50 ? 1 : -1) +
(ema50 > ema200 ? 1 : -1)
= ta.dmi(14, 14)
Regimes covered:
Danger : high volatility with weak trend.
Volatile : volatility elevated but structure still directional.
Choppy : low ADX and noisy action.
Trending : directional flows without extreme volatility.
Mixed : anything between.
Each regime maps to a 1–10 risk score and a multiplier that feeds the final position size. Danger and Choppy clamp size; Trending restores normal risk.
---
4. Behaviour engine – trader inputs matter 🧠
You provide:
Emotional state : Confident, Neutral, FOMO, Revenge, Fearful.
Confidence : slider from 1 to 10.
Toggle for behavioural adjustment on/off.
Behind the scenes:
Each state triggers an emotional multiplier .
Confidence produces a confidence multiplier .
Combined they form behavioralFactor and a 0–100 Behavioural Score .
High-risk emotions or low conviction clamp the final risk. Calm inputs allow normal size. The dashboard prints both fields to keep accountability on-screen.
---
5. Correlation guardrail – avoid stacking identical risk 📊
Optional correlation mode compares the active symbol to a reference (default AMEX:SPY ):
corrClose = request.security(correlationSymbol, timeframe.period, close)
priceReturn = ta.change(close) / close
corrReturn = ta.change(corrClose) / corrClose
correlation = calcCorrelation()
Absolute correlation above the threshold applies a correlation multiplier (< 1) to reduce size.
Dashboard row shows the live correlation and reference ticker.
When disabled, the row simply echoes the current symbol, keeping the table readable.
---
6. Position sizing engine – heart of the script 💰
baseRiskAmount = accountSize * (baseRiskPercent / 100)
adjustedRisk = baseRiskAmount * behavioralFactor *
regimeAdjustment * volAdjustment *
correlationAdjustment
finalRiskAmount = math.min(adjustedRisk,
accountSize * (maxRiskCap / 100))
stopDistance = atr * atrStopMultiplier
takeProfit = atr * atrTargetMultiplier
positionSize = stopDistance > 0 ? finalRiskAmount / stopDistance : 0
positionValue = positionSize * close
Outputs shown on the dashboard:
Position size in units and value in currency.
Actual risk % back on account after adjustments.
Risk/Reward derived from ATR-based stop and target.
---
7. Intelligent trade direction – bias without signals 🎯
Direction score ingredients:
EMA stack alignment.
Price versus EMA20.
RSI momentum relative to 50.
MACD line vs signal.
Directional Movement (DI+/DI–).
The resulting Trade Direction row prints LONG, SHORT, or NEUTRAL. No orders are generated—this is guidance so you only risk capital when the structure supports it.
---
8. Stop/target guide lines – two lines only ✂️
if showStopLines
if preferLong
// long stop below, target above
else if preferShort
// short stop above, target below
Lines refresh each bar to keep clutter low.
When the direction score is neutral, no lines appear.
Use them as visual anchors, not auto-orders.
---
9. Session Risk map – global volatility clock 🌍
Tracks Asian, London, and New York windows via UTC.
Computes average ATR per session versus global ATR SMA.
Labels each session High/Med/Low and colours the cells accordingly.
Top row shows the active session plus current UTC time so you always know the regime you are trading.
One glance tells you whether you are trading quiet drift or the part of the day that hunts stops.
---
10. Floating risk badge – honesty above price 🪪
Text ranges from Ultra Cautious through Very Aggressive.
Colour matches the risk palette inputs (High/Med/Low).
Updates on the last bar only, keeping historical clutter off the chart.
Account risk becomes impossible to ignore while you stare at price.
---
11. Education engine & warnings 📚
Rotates evergreen principles (risk 1–2%, journal trades, respect plan).
Triggers contextual warnings when volatility and risk % conflict.
Flags when emotional state = FOMO or Revenge.
Highlights sub-standard risk/reward setups.
When multiple danger flags stack, an AI-style warning overrides the tip text so you can course-correct before capital is exposed.
---
12. Alerts – hard guard rails 🚨
Excessive Risk Alert : actual risk % crosses custom threshold.
High Volatility Alert : ATR behaviour signals danger regime.
Emotional State Warning : FOMO or Revenge selected.
Poor Risk/Reward Alert : risk/reward drops below your standard.
All alerts reinforce discipline; none suggest entries or exits.
---
13. Multi-market behaviour 🕒
Intraday (1m–1h): session box and badge react quickly; ideal for scalpers needing constant risk context.
Higher time frames (1D–1W): dashboard shifts slowly, supporting swing planning.
Asset classes confirmed in validation: crypto majors, large-cap equities, indices, major FX pairs, and liquid commodities.
Risk logic is price-based, so it adapts across markets without bespoke tuning.
15. Key inputs & recommended defaults
Account Size : 10,000 (modify to match actual account; min 100).
Base Risk % : 1.0 with a Maximum Risk Cap of 2.5%.
ATR Period : 14, Stop Multiplier 2.0, Target Multiplier 3.0.
High Vol Threshold : 1.5 for ATR ratio.
Behavioural Adjustment : enabled by default; disable for fixed risk.
Correlation Check : optional; default symbol AMEX:SPY , threshold 0.7.
Display toggles : main dashboard, risk badge, session map, education panel, and stop lines can be individually disabled to reduce clutter.
16. Usage notes & limits
Indicator mode only; no automated entries or exits.
Trade history panel intentionally disabled (requires strategy context).
Correlation analysis depends on additional data requests and may lag slightly on illiquid symbols.
Session timing uses UTC; adjust expectations if you trade localized instruments.
HTF ATR sampling uses daily data, so bar replay on lower charts may show brief data gaps while HTF loads.
What does everyone think RISK really means?

MTF S/R Array - Full CustomA clean, institutional-style multi-timeframe support and resistance indicator designed for precision trading decisions. Plots previous and current period levels with full customization for backtesting and live trading.
━━━━━━━━━━━━━━━━━━━━━━
WHAT IT PLOTS
━━━━━━━━━━━━━━━━━━━━━━
MONTHLY
- Previous Month High / Low / Close
- Previous Month Highest Closing Price
- Current Month High / Low / Highest Close
WEEKLY
- Previous Week High / Low / Close
- Current Week High / Low
DAILY
- Previous Day High / Low / Close
- Current Day High / Low
SESSIONS (Full Session - EST)
- Asian: 7pm - 4am
- London: 3am - 12pm
- New York: 8am - 5pm
OPENING RANGE
- Monday/Tuesday combined high and low
- Clean box visualization for weekly initial balance
━━━━━━━━━━━━━━━━━━━━━━
WHY THESE LEVELS MATTER
━━━━━━━━━━━━━━━━━━━━━━
Institutions and smart money reference these key levels for:
- Liquidity targets
- Stop hunts
- Reversal zones
- Trend continuation entries
Previous period levels act as magnets for price. Current levels show where the battle is happening now.
━━━━━━━━━━━━━━━━━━━━━━
FULL CUSTOMIZATION
━━━━━━━━━━━━━━━━━━━━━━
Every level type has independent controls:
- Show/Hide Previous and Current separately
- Extend Bars - control how far each level stretches
- Line Width - adjust thickness per level
- Transparency - fade previous levels for clarity
- Colors - separate colors for High/Low vs Close
Additional settings:
- Labels on/off with size and style options
- Info table with position and size controls
- Opening range box transparency and border width
━━━━━━━━━━━━━━━━━━━━━━
HOW TO USE
━━━━━━━━━━━━━━━━━━━━━━
1. Use on lower timeframes (1m, 5m, 15m) to see HTF levels
2. Watch for price reactions at previous period highs/lows
3. Look for session high/low sweeps followed by reversals
4. Use Monday/Tuesday opening range for weekly bias and targets
5. Previous levels extend further back for backtesting context
━━━━━━━━━━━━━━━━━━━━━━
TIPS
━━━━━━━━━━━━━━━━━━━━━━
- Increase "Prev Extend Bars" on monthly/weekly to see levels across more history
- Use higher transparency on previous levels to keep chart clean
- Turn off sessions you don't trade to reduce clutter
- The info table shows all values at a glance - position it where it doesn't block price action
━━━━━━━━━━━━━━━━━━━━━━
BEST FOR
━━━━━━━━━━━━━━━━━━━━━━
- ICT / Smart Money Concepts traders
- Session-based strategies
- Swing traders using HTF levels on LTF entries
- Anyone who wants clean, customizable S/R levels
Works on Forex, Crypto, Stocks, Futures, and Indices.
